The yield curve is one of the most powerful and reliably predictive tools in all of economics — a simple graph that has preceded nearly every US recession in modern history and that professional investors, central bankers, and economists monitor obsessively. Yet to most people outside of finance, it remains an obscure technical concept associated with bond markets they have never directly participated in. This guide explains the yield curve from first principles, covers its three main shapes and what each signals, explains the mechanism by which an inverted yield curve predicts recessions, and — most importantly — translates what the yield curve’s current shape means for your financial decisions.
💡 Also in this cluster:
How Interest Rates Work — The Price of Money and Why It Affects Everything in Your Financial Life
Interest Rates and Bond Prices — Why They Always Move in Opposite Directions
What the Yield Curve Is
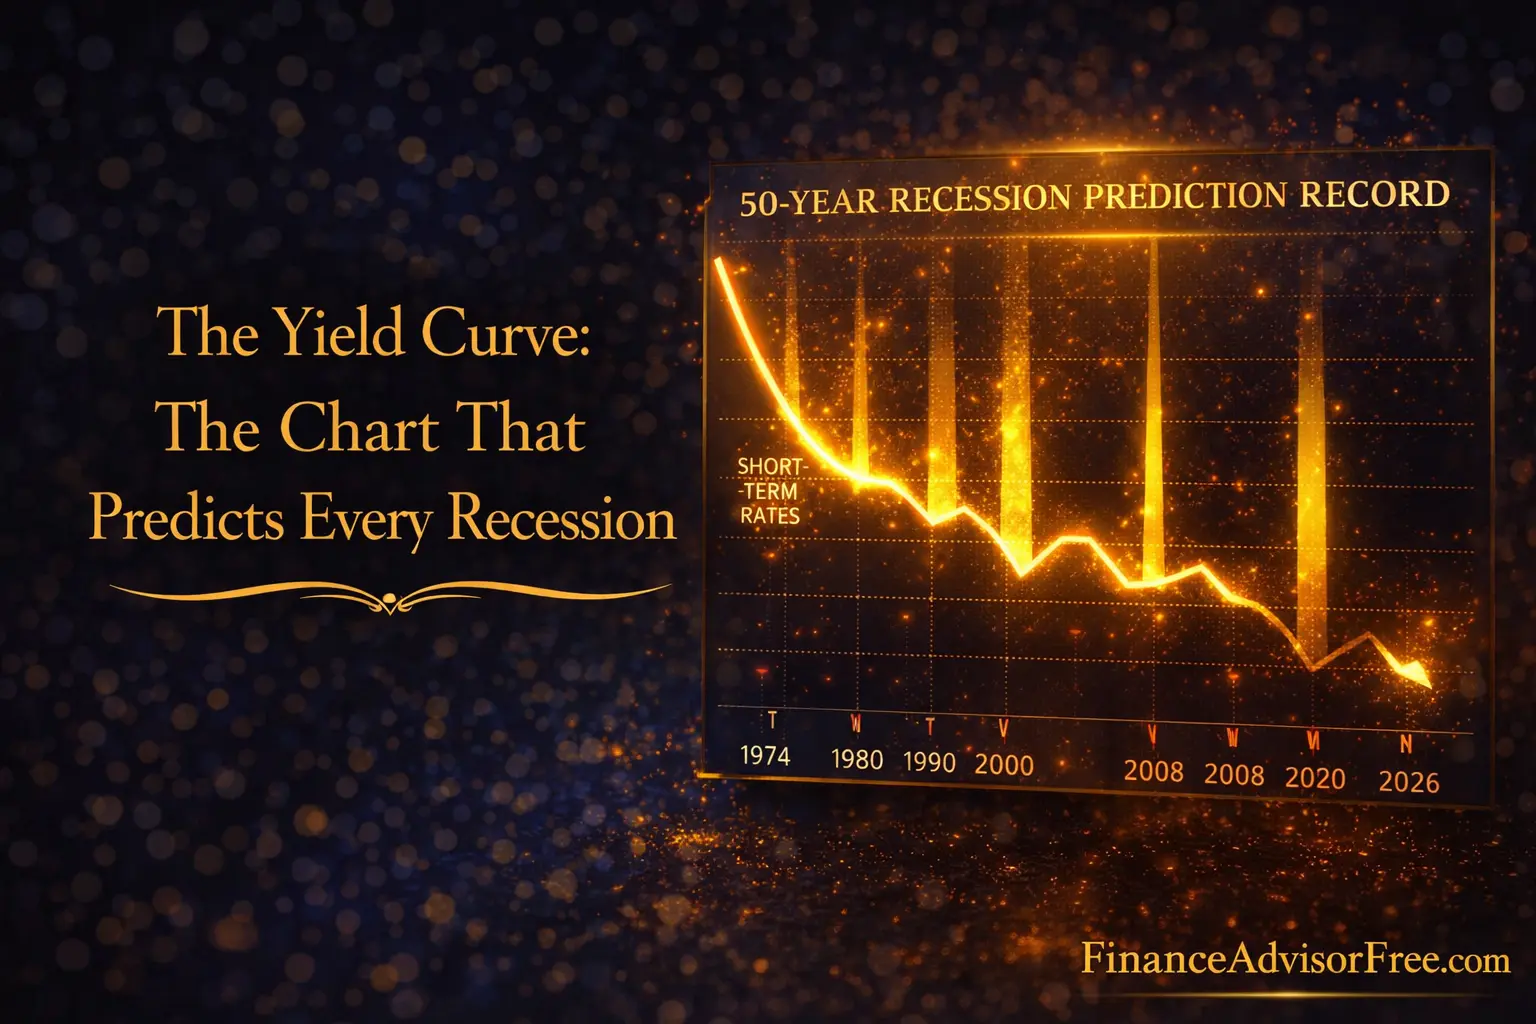
The yield curve is a graph that plots the yields (interest rates) of US Treasury bonds across different maturities — from very short-term (3-month Treasury bills) to very long-term (30-year Treasury bonds). The horizontal axis shows time to maturity; the vertical axis shows the yield. At any given moment, you can plot this curve and read the current market yield for any Treasury maturity from it.
Why Treasury yields? Because US Treasury securities are considered risk-free — backed by the full faith and credit of the US government — the yield curve for Treasuries shows the “pure” time value of money, free from credit risk complications. It reflects only the price of borrowing across different time horizons, making it a clean signal of market expectations about future interest rates and economic conditions.
The yield curve is not static. It shifts continuously as market conditions change, new economic data arrives, and the Fed adjusts monetary policy. On any given trading day, each Treasury maturity’s yield moves slightly, reshaping the curve. The shape of the curve at any moment — whether it slopes upward, is flat, or has inverted — carries significant information about what markets collectively expect to happen to the economy.
The Three Yield Curve Shapes — and What Each Means
Normal Yield Curve — Upward Sloping
A normal yield curve slopes upward from left to right: short-term rates are lower than long-term rates. A 3-month bill might yield 3.5% while a 10-year bond yields 4.5% and a 30-year bond yields 5.0%. This shape prevails during most economic expansions and reflects several rational expectations: investors demand higher returns for committing their money for longer periods (the term premium), markets expect moderate economic growth and stable inflation over the long term, and the Fed is not actively suppressing long-term rates.
A steeply upward-sloping curve — where the gap between short and long rates is large — is typically associated with early economic recovery phases. The Fed has cut short-term rates to stimulate the economy, but long-term rates have risen as markets anticipate the recovery will eventually produce inflation and higher future rates. This steep curve benefits banks substantially: banks borrow short-term (at low rates) and lend long-term (at high rates), earning a wide net interest margin. The steep curve environment of 2010–2015 was exceptionally profitable for banks.
Flat Yield Curve
A flat yield curve occurs when short-term and long-term rates are approximately equal — the curve has little or no slope. This typically appears as a transitional shape during periods when the Fed is raising short-term rates (pushing short rates higher) while long-term rates remain anchored by moderate long-term growth expectations. A flat curve reduces bank profitability (the spread between borrowing and lending rates compresses) and may signal that markets are uncertain about the economic outlook.
Flat curves often appear just before yield curve inversion — as short rates continue to rise toward or above long rates. They are therefore watched as potential leading indicators of the more significant signal: the inverted curve.
Inverted Yield Curve — The Recession Predictor
An inverted yield curve occurs when short-term rates exceed long-term rates — the curve slopes downward from left to right. A 3-month Treasury bill yielding 5.5% while a 10-year bond yields 4.3% is an inversion of 120 basis points. This is the most closely watched and most economically significant yield curve shape, because an inverted yield curve has preceded every US recession since 1955, with only one false signal (a brief inversion in 1966 that was not followed by a recession).
The 2-year/10-year Treasury spread is the most widely monitored measure of inversion. When 2-year yields exceed 10-year yields, the spread is negative and the yield curve is inverted at that portion. This spread inverted in July 2022, remained deeply inverted through most of 2023, and began to normalise through 2024 — consistent with its historical pattern of inverting 6 to 24 months before a recession begins.
1973 inversion → 1973–74 recession (oil shock)
1978–79 inversion → 1980 recession and 1981–82 double-dip
1988–89 inversion → 1990–91 recession
2000 inversion → 2001 recession (dot-com bust)
2006–07 inversion → 2007–09 Great Recession
2019 inversion → 2020 recession (COVID — uniquely short due to unique cause)
2022–23 inversion → Recession? As of 2026 — still debated; soft landing or delayed consequence
Historical lead time from inversion to recession: 6 to 24 months (median ~12–14 months)
Why an Inverted Yield Curve Predicts Recessions — The Mechanism
The yield curve’s predictive power is not accidental — it reflects real economic mechanisms that translate an inverted curve into recessionary outcomes. Understanding these mechanisms helps you evaluate how seriously to take any given inversion signal and what economic dynamics are playing out.
The Bank Lending Channel
Banks are fundamentally in the business of maturity transformation — they borrow short-term (deposits, overnight funding) and lend long-term (mortgages, business loans). Their profitability depends on the spread between what they pay for short-term funding and what they earn on long-term loans. When the yield curve inverts, this spread collapses or turns negative — banks cannot profitably extend new long-term loans when short-term funding costs more than long-term loan rates. The result: banks tighten lending standards, reduce credit availability, and shrink their loan books. Reduced credit availability slows economic activity — businesses cannot borrow to invest, consumers cannot borrow to spend — which contributes to the recession the inverted curve predicted.
The Expectations Channel
An inverted yield curve also reflects market expectations embedded in the prices of bonds. Long-term yields are partly determined by where markets expect short-term rates to be over the long-term horizon. When long-term yields fall below current short-term yields, markets are essentially pricing in future rate cuts — which the Fed typically executes when the economy weakens. The inversion is the bond market’s collective prediction that the current tight monetary policy will eventually cause enough economic weakness to force the Fed to cut rates dramatically. This expectation — that recession is coming — can itself become self-fulfilling as businesses and consumers anticipate the downturn and reduce investment and spending in advance.
The Risk Appetite Signal
Investors seeking safety during uncertain times buy long-term Treasury bonds (pushing their prices up and yields down), while short-term rates remain high due to Fed policy. This “flight to safety” into long bonds at the same time as short rates are elevated by monetary tightening is itself a signal of declining risk appetite — investors are betting on safety over growth, which is characteristic of late-cycle economic behaviour.
How to Use the Yield Curve in Your Financial Planning
For most individuals, the yield curve is useful as a macroeconomic monitoring tool — one data point among several that can inform major financial timing decisions. It is not a precise market-timing instrument, and the historical lead times from inversion to recession (6 to 24 months) are too variable to base specific investment decisions upon. But combined with other economic signals, it provides genuine predictive value.
When the yield curve is inverted or has recently inverted, strengthening your financial cushion makes sense regardless of whether a recession actually follows. Building or maintaining a full emergency fund, reducing high-interest variable-rate debt (which becomes more expensive in tight monetary environments), avoiding major leveraged commitments (new mortgage, business expansion) that would strain finances in a downturn, and ensuring your investment portfolio is appropriately diversified rather than concentrated in cyclically sensitive assets are all prudent responses to an inverted curve signal.
When the yield curve is normal and steep, economic conditions are typically favourable for growth — rates are low, credit is available, and the economic outlook is positive. This is typically a favourable environment for equity investments, real estate, and career advancement. Locking in low fixed borrowing rates (mortgages, fixed-rate loans) during a steep curve environment can be particularly advantageous if rates are expected to rise.
| Yield Curve Shape | Economic Signal | Personal Finance Implication |
|---|---|---|
| Normal (upward slope) | Expansion expected; rates moderate | Favourable for borrowing, investing, career moves |
| Steep (very upward) | Recovery; short rates low, growth expected | Lock in low long-term borrowing rates now |
| Flat | Late cycle; transition signal; uncertainty rising | Build emergency fund; reduce unnecessary risk |
| Inverted | Recession warning; market expects rate cuts | Strengthen emergency fund; reduce variable debt; maintain equity allocation |
| Deeply inverted (−100bps+) | Strong recession signal; credit tightening likely | Ensure job security awareness; review debt levels; do not panic-sell investments |
Frequently Asked Questions
What exactly is the “2-10 spread” that financial media talks about?
The 2-10 spread is the difference between the yield on the 2-year US Treasury note and the yield on the 10-year US Treasury note. It is calculated as (10-year yield minus 2-year yield). When this number is positive, the curve is normally sloped at this portion — 10-year yields exceed 2-year yields. When it is negative, the curve is inverted at this portion. The 2-10 spread is the most widely followed yield curve measure because it captures the core tension between the Fed-influenced short end (the 2-year is highly responsive to expected Fed policy) and the market-determined long end (the 10-year reflects longer-term economic expectations). You can find it published daily by the Federal Reserve Bank of St. Louis at fred.stlouisfed.org.
Can the yield curve invert without a recession following?
Yes — there have been very brief, shallow inversions that did not precede recessions, and economists debate whether the 2022–2023 inversion will ultimately be followed by a recession. The 1966 episode is the clearest false positive in the modern record. However, deep and sustained inversions — where the 2-10 spread goes significantly negative and stays there for months — have an essentially perfect recession-prediction record in the post-war United States. The 2022–2023 inversion was both deep (exceeding 100 basis points at its peak) and sustained (lasting over a year), placing it among the more significant historical inversions. Whether it ultimately produces a recognised recession or not, it correctly signalled significant economic tightening and stress.
Why do some economists say the yield curve has “lost its predictive power”?
This argument surfaces after every inversion that is not immediately followed by a recession, and it should be viewed with appropriate scepticism. The argument typically rests on the claim that quantitative easing distorted the term structure of Treasury yields, making the traditional yield curve less informative. There is genuine substance to this concern: massive Fed bond purchases during 2010–2021 may have artificially suppressed long-term yields relative to where they would have been without intervention, potentially making the curve appear more inverted than underlying economic conditions warranted. However, the underlying mechanism — tight monetary policy suppressing credit creation, which slows the economy — remains intact regardless of QE effects. Most economists continue to view the yield curve as a useful, if imperfect, leading indicator.
Does the yield curve affect mortgage rates?
Indirectly, yes. Mortgage rates are priced primarily off the 10-year Treasury yield, which is a point on the yield curve. When the overall level of the yield curve shifts up — as happened during 2022–2023 — mortgage rates rise accordingly. When the shape of the yield curve changes — when the curve inverts because short rates rise faster than long rates — mortgage rates may rise less than short-term rates, because the 10-year yield (and therefore mortgage rates) is more anchored by long-term expectations than by the Fed’s immediate rate action. This is actually what happened in 2022: the Fed raised the federal funds rate by 525 basis points, but 30-year mortgage rates rose by only about 400 basis points — because long-term rates were contained by expectations that the Fed would eventually cut rates again.
This article is for informational purposes only and does not constitute financial or economic advice. Economic predictions based on yield curve signals involve genuine uncertainty and should not be the sole basis for financial decisions. Please consult a qualified financial advisor for personalised guidance.