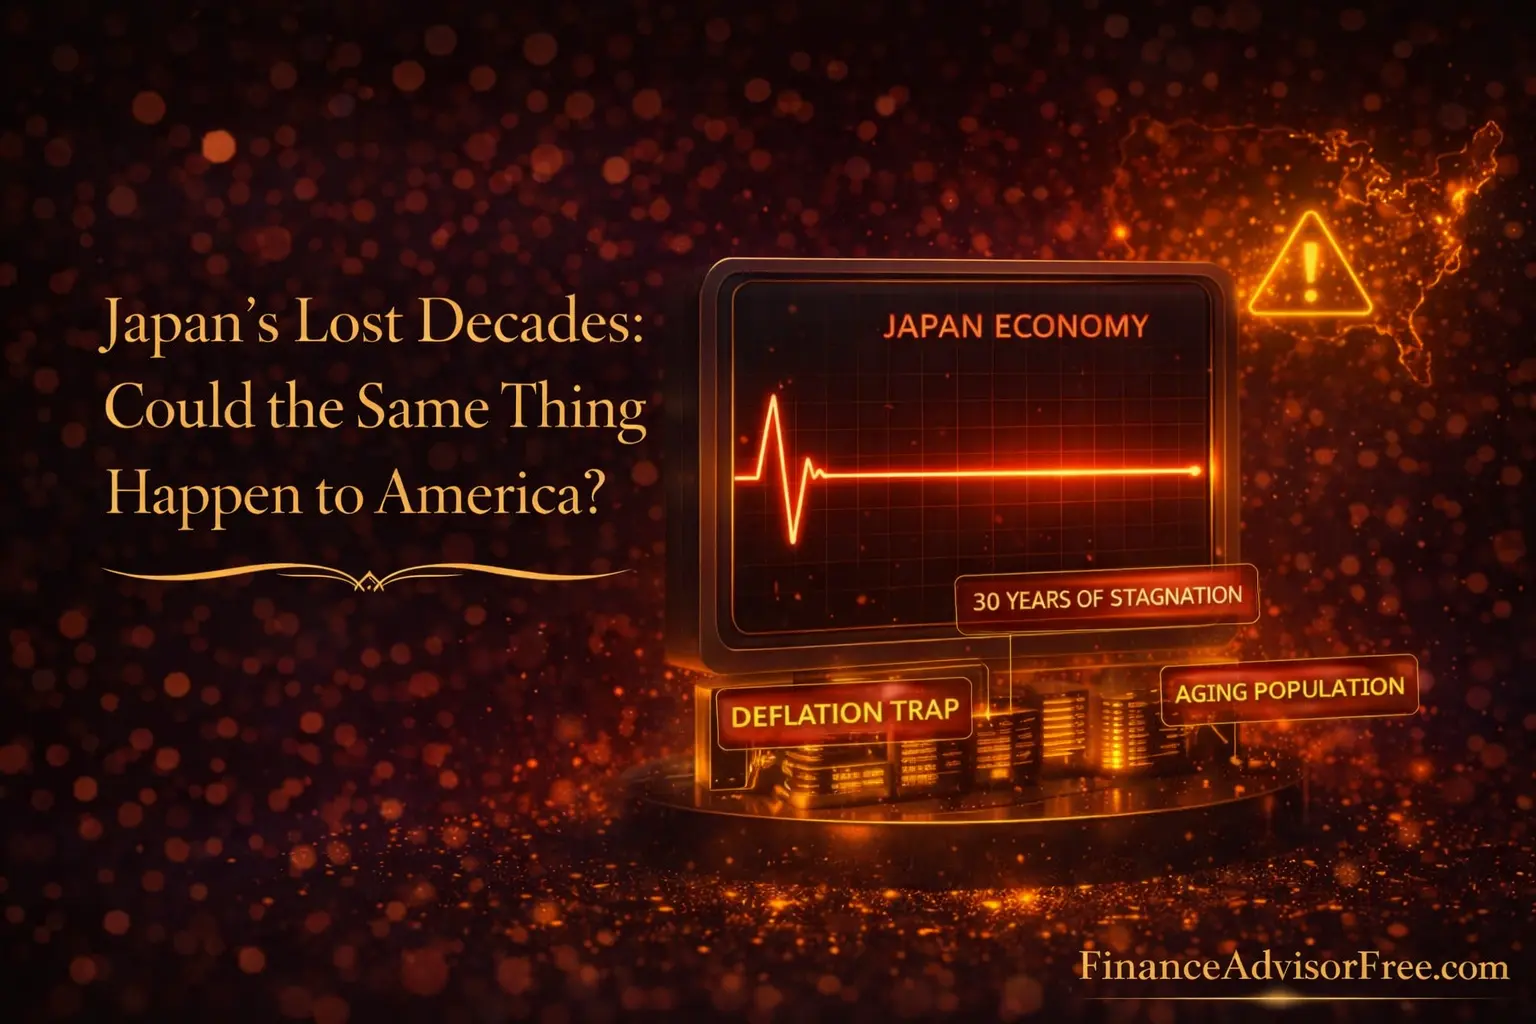
Japan’s lost decades represent one of the most important — and most studied — episodes in modern economic history. From 1989 to approximately 2023, Japan’s economy experienced three decades of near-zero growth, persistent deflation, and stock and property markets that failed to recover to their bubble-era peaks. The Nikkei 225 index peaked at 38,957 in December 1989 and did not sustainably reclaim that level until 2024 — 35 years later. Understanding what caused this extraordinary stagnation, why the standard economic policy toolkit failed, and whether similar dynamics could emerge elsewhere provides essential context for evaluating investment risks in Japan today and in economies that share Japan’s structural vulnerabilities — including China and, by some analyses, eventually the United States.
💡 Also in this cluster:
China’s Economy in 2026 — Growth, Slowdown and What It Means for Global Markets
The US-China Economic Rivalry — How the World’s Two Biggest Economies Are Decoupling
The Bubble — How Japan Got There
Japan’s economic miracle from the 1950s through the 1980s was one of the most impressive in recorded history. From the ashes of WWII, Japan built the world’s second-largest economy through export-led manufacturing, high savings rates, extraordinary industrial policy, and a uniquely cohesive social contract between government, corporations, and workers. By the late 1980s, Japan seemed unstoppable — Japanese companies were buying landmark American properties and cultural icons, Japanese manufacturing quality set the global standard, and Japanese banks were the largest in the world by assets.
The excess was extraordinary. At the Nikkei’s 1989 peak, Japanese equity markets had a price-to-earnings ratio of approximately 60 — three times the historical US average. Japanese property values became untethered from any reasonable income relationship: the land under the Imperial Palace in Tokyo was theoretically worth more than the entire state of California. Ultra-low interest rates, financial deregulation, and abundant credit fuelled the speculation, as banks lent aggressively against rising collateral values in a self-reinforcing cycle that seemed sustainable precisely because it had continued so long.
Nikkei 225 peak (December 1989): 38,957
Nikkei trough (March 2009): 7,054 — an 82% collapse
Year Nikkei reclaimed its 1989 peak: 2024 — 35 years later
Japan’s average annual GDP growth, 1991–2020: ~0.8%
Average Japanese consumer price inflation, 1994–2020: ~0.1%
Bank of Japan policy rate, 2016–2022: Negative (−0.1%)
Japan’s government debt-to-GDP ratio (2026): ~230% — highest among developed nations
The Collapse — What Went Wrong
The Bank of Japan began raising interest rates in 1989 to cool speculative excess, and the bubble popped with devastating force. Between 1989 and 1992, the Nikkei fell approximately 60%. Commercial property values fell 70–80% from their peak over the subsequent decade. The financial system was left holding enormous non-performing loans secured against collateral that had lost most of its value.
What turned a painful but potentially recoverable asset price bust into three lost decades was a series of policy failures that compounded the initial shock. Japanese banks and corporations — rather than writing off bad loans and recapitalising as quickly as possible — were allowed to carry the impaired assets at inflated values on their balance sheets, consuming management attention, capital, and lending capacity without recognising the losses. These “zombie banks” and “zombie companies” remained technically alive but unable to grow or lend productively. New credit creation collapsed. Deflationary psychology took hold — consumers expecting prices to fall further delayed purchases, businesses expecting weaker demand delayed investment, creating a self-reinforcing deflationary spiral that monetary policy struggled to break even at zero interest rates.
The Japanese government responded with repeated fiscal stimulus programmes — infrastructure spending that built bridges to nowhere and created temporary construction employment without addressing the underlying structural problems. Public debt ballooned. Each stimulus produced a brief uptick that faded when the spending ended, leaving higher debt without higher sustainable growth. The fiscal response confused activity for investment, treating debt accumulation as evidence of action.
Why Conventional Policy Failed — The Liquidity Trap
Japan’s experience introduced much of the developed world to a concept that had previously been considered a theoretical curiosity: the liquidity trap. When interest rates reach zero, conventional monetary policy loses its primary tool — rates cannot go below zero (or so it seemed) — and the economy can remain stuck in a low-growth, low-inflation equilibrium despite the central bank’s best efforts. Banks receive reserves but don’t lend; companies receive cheap credit but don’t invest; consumers receive low rates but save rather than spend because of balance sheet repair needs and deflationary expectations.
The Bank of Japan became the world’s laboratory for unconventional monetary policy. It tried zero interest rates (1999), quantitative easing (2001 — the first major central bank to do so), negative interest rates (2016), and ultimately yield curve control (2016), committing to keep the 10-year government bond yield near zero by purchasing unlimited quantities. These innovations influenced central bank policy worldwide — the Fed’s QE programmes during and after the financial crisis and COVID drew directly on Japan’s experience. But none fully broke Japan’s deflationary stagnation until the global inflationary shock of 2021–2022 finally began transmitting to Japan’s price levels through import costs.
Japan’s Redemption — What Finally Changed
After decades of stagnation, Japan’s economy and stock market have staged a remarkable recovery that has caught global investors’ attention. The Nikkei 225 finally reclaimed its 1989 all-time high in 2024, driven by a combination of structural corporate reform, currency weakness boosting exporters, and the global inflation shock finally awakening Japan’s price levels after three decades of flatness.
The most important structural change has been in corporate governance. Pressure from the Tokyo Stock Exchange — which in 2023 threatened to delist companies trading below book value unless they improved capital returns — finally began shifting Japan’s notoriously conservative corporate culture. Share buybacks and dividend increases from cash-rich Japanese companies accelerated dramatically, attracting international investors who had long avoided Japan due to poor capital allocation. Warren Buffett’s 2020–2023 investments in the five largest Japanese trading companies — Itochu, Marubeni, Mitsubishi, Mitsui, and Sumitomo — drew global attention to the value opportunity in Japanese equities trading at steep discounts to their asset values.
The Bank of Japan’s cautious exit from its ultra-loose monetary policy stance — raising rates modestly in 2024 after years of negative rates — represents a genuine turning point. If Japan can normalise monetary policy without triggering a new deflationary crisis, it will validate that the lost decades have finally ended. The risks of this transition — yen appreciation that hurts exporters, higher government borrowing costs on a massive debt load — are real and warrant monitoring.
Could It Happen in America? — The Comparison
The “Japan scenario” is periodically invoked as a warning for the United States, particularly by those concerned about the long-term consequences of the post-2008 monetary policy regime. The parallels are real enough to deserve serious consideration: excessive debt accumulation, asset price inflation fuelled by loose monetary policy, aging demographics, and a potential deflationary trap if the right policy response is delayed.
However, the US and Japan differ in ways that make a direct replication of Japan’s experience unlikely, though not impossible. The US financial system’s response to the 2008 crisis — which involved relatively rapid (if painful) bank recapitalisation through TARP and stress tests — was substantially faster than Japan’s decade-long zombie bank forbearance. The US also has significantly stronger population growth from immigration, a more flexible labour market, a more entrepreneurial business culture, and world-class technology sector dynamism that provides ongoing productivity growth Japan largely lacked. And the dollar’s reserve currency status provides the US with fiscal borrowing capacity that Japan’s yen-denominated debt cannot fully replicate.
The US risks that most echo Japan’s trajectory are the commercial real estate correction (smaller scale than Japan’s property bust but structurally similar), the challenge of unwinding decades of monetary stimulus without triggering asset price deflation, and the long-run demographic and fiscal pressure from an aging population. These are real risks that deserve serious monitoring — but they argue for gradual portfolio adjustments rather than Japan-inspired pessimism about US economic prospects.
| Factor | Japan (1990s) | US (2026) | China (2026) |
|---|---|---|---|
| Property bubble severity | Extreme — 70–80% decline | Moderate — office sector stress | Severe — 20–40% declines in many markets |
| Banking system response | Forbearance — decade of zombie banks | Rapid recapitalisation (2009) | Partial forbearance — ongoing |
| Demographics | Rapidly aging; low immigration | Aging but immigration offset | Rapidly aging; low immigration |
| Debt-to-GDP | Rose to 230%+ over lost decades | 130% and rising | 300%+ (government + corporate + household) |
| Technology sector dynamism | Limited — manufacturing-focused | World-leading AI and tech | Growing but export-restricted |
| Deflationary psychology | Entrenched for 30 years | Not entrenched | Emerging — risk factor |
Frequently Asked Questions
Did Japan’s economy really stagnate for 30 years?
The “lost decades” narrative captures the overall trajectory accurately but obscures important nuance. Japan never experienced a Great Depression-style collapse — unemployment peaked around 5%, living standards remained high by global standards, and quality of life metrics (health, safety, social cohesion) remained excellent throughout. What was lost was economic dynamism: entrepreneurship, productivity growth, corporate innovation, and the sense of progress that economic growth produces. Japan’s per capita GDP in purchasing power terms remained among the world’s highest even during the lost decades — the country stagnated relative to its own trajectory and relative to peer nations, not relative to the developing world. The tragedy was the gap between what Japan could have achieved and what it did — not absolute decline into poverty.
Is China going to have its own lost decade?
The parallels between China 2026 and Japan 1990 are compelling enough that leading economists — including former Treasury Secretary Larry Summers — have made this comparison explicitly. Both feature a property bubble deflating after credit excess, an aging population, a current account surplus economy that resists the consumption-led growth needed to rebalance, and a government inclined toward forbearance over forced write-downs. The key difference is that China is still a middle-income country with significant productivity catch-up potential, while Japan was already at the frontier when its lost decades began. Whether China successfully navigates to a new growth model or gets trapped in a Japan-style stagnation is the single most important medium-term question in global economics.
What lessons should investors take from Japan’s experience?
Three lessons stand out as most practically relevant. First, asset valuations can remain far below previous peaks for very long periods — the lesson that “stocks always recover” is time-frame dependent and does not apply to all markets in all periods. Second, monetary policy has limits — even zero or negative interest rates cannot reliably restore growth when balance sheet repair and deflationary psychology are the binding constraints. Third, corporate governance quality matters enormously for equity returns — Japan’s recovery has been driven significantly by governance improvement that finally unlocked the value in cash-hoarding companies. These lessons argue for maintaining geographic diversification (never full concentration in one market, however dominant it seems), avoiding the assumption that central banks can always stabilise economies, and paying attention to shareholder return policies when evaluating international equity opportunities.
This article is for informational purposes only and does not constitute financial advice. Historical economic patterns do not guarantee future outcomes. Investment involves risk. Please consult a qualified financial advisor before making investment decisions.